Normalizing Flow Estimator
The Normalizing Flow Estimator (NFE) combines a conventional neural network (in our implementation specified as \(estimator\)) with a multi-stage Normalizing Flow [REZENDE2015] for modeling conditional probability distributions \(p(y|x)\). Given a network and a flow, the distribution \(y\) can be specified by having the network output the parameters of the flow given an input \(x\) [TRIPPE2018]. If the normalizing flow is expressive enough, arbitrary conditional distributions can be approximated.
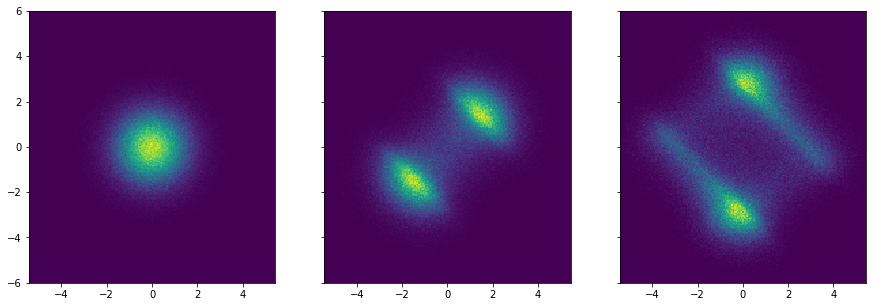
The flows work by transforming a base distribution (in our case a normal distribution) into successively more complex distributions by applying bijectors.
Example of a normal distribution being transformed by two planar flows:
Using the change of variable formula, the resulting probability distribution \(p_1\) for a single flow \(f\) applied to the base distribution \(p_0\) becomes:
Using normalizing flows for density estimation requires that the inverse and the Jacobian determinant of the flow can be calculated quickly.
Given input \(x\), the neural network outputs the parameters \(\theta\) of the flows. The weights and biases \(w\) of the neural network are learned by minimizing the negative logarithm of the likelihood (maximum likelihood) over \(N\) data points for a normalizing flow consisting of \(K\) flows.
Available flows:
-
class
cde.density_estimator.NormalizingFlowEstimator(name, ndim_x, ndim_y, flows_type=('affine', 'radial', 'radial', 'radial'), hidden_sizes=(16, 16), hidden_nonlinearity=<function tanh>, n_training_epochs=1000, x_noise_std=None, y_noise_std=None, weight_decay=0.0, weight_normalization=True, data_normalization=True, dropout=0.0, random_seed=None)[source]¶ Normalizing Flow Estimator
- Parameters
name – (str) name space of the network (should be unique in code, otherwise tensorflow namespace collisions may arise)
ndim_x – (int) dimensionality of x variable
ndim_y – (int) dimensionality of y variable
flows_type – (tuple of strings) The chain of individual flows that together make up the full flow. The individual flows can be any of: affine, planar, radial, identity. They will be applied in order going from the base distribution to the transformed distribution.
hidden_sizes – (tuple of int) sizes of the hidden layers of the neural network
hidden_nonlinearity – (tf function) nonlinearity of the hidden layers
n_training_epochs – (int) Number of epochs for training
x_noise_std – (optional) standard deviation of Gaussian noise over the the training data X -> regularization through noise
y_noise_std – (optional) standard deviation of Gaussian noise over the the training data Y -> regularization through noise
weight_decay – (float) the amount of decoupled (http://arxiv.org/abs/1711.05101) weight decay to apply
weight_normalization – (boolean) whether weight normalization shall be used for the neural network
data_normalization – (boolean) whether to normalize the data (X and Y) to exhibit zero-mean and uniform-std
dropout – (float) the probability of switching off nodes during training
random_seed – (optional) seed (int) of the random number generators used
-
cdf(X, Y)¶ Predicts the conditional cumulative probability p(Y<=y|X=x). Requires the model to be fitted.
- Parameters
X – numpy array to be conditioned on - shape: (n_samples, n_dim_x)
Y – numpy array of y targets - shape: (n_samples, n_dim_y)
- Returns
conditional cumulative probability p(Y<=y|X=x) - numpy array of shape (n_query_samples, )
-
conditional_value_at_risk(x_cond, alpha=0.01, n_samples=1000000)¶ Computes the Conditional Value-at-Risk (CVaR) / Expected Shortfall of the fitted distribution. Only if ndim_y = 1
- Parameters
x_cond – different x values to condition on - numpy array of shape (n_values, ndim_x)
alpha – quantile percentage of the distribution
- Returns
CVaR values for each x to condition on - numpy array of shape (n_values)
-
covariance(x_cond, n_samples=1000000)¶ Covariance of the fitted distribution conditioned on x_cond
- Parameters
x_cond – different x values to condition on - numpy array of shape (n_values, ndim_x)
- Returns
Covariances Cov[y|x] corresponding to x_cond - numpy array of shape (n_values, ndim_y, ndim_y)
-
eval_by_cv(X, Y, n_splits=5, verbose=True)¶ Fits the conditional density model with cross-validation by using the score function of the BaseDensityEstimator for scoring the various splits.
- Parameters
X – numpy array to be conditioned on - shape: (n_samples, n_dim_x)
Y – numpy array of y targets - shape: (n_samples, n_dim_y)
n_splits – number of cross-validation folds (positive integer)
verbose – the verbosity level
-
fit(X, Y, random_seed=None, verbose=True, eval_set=None, **kwargs)[source]¶ Fit the model with to the provided data
- Parameters
X – numpy array to be conditioned on - shape: (n_samples, n_dim_x)
Y – numpy array of y targets - shape: (n_samples, n_dim_y)
eval_set – (tuple) eval/test dataset - tuple (X_test, Y_test)
verbose – (boolean) controls the verbosity of console output
-
fit_by_cv(X, Y, n_folds=3, param_grid=None, random_state=None, verbose=True, n_jobs=-1)¶ Fits the conditional density model with hyperparameter search and cross-validation.
Determines the best hyperparameter configuration from a pre-defined set using cross-validation. Thereby, the conditional log-likelihood is used for simulation_eval.
Fits the model with the previously selected hyperparameter configuration
- Parameters
X – numpy array to be conditioned on - shape: (n_samples, n_dim_x)
Y – numpy array of y targets - shape: (n_samples, n_dim_y)
n_folds – number of cross-validation folds (positive integer)
param_grid –
(optional) a dictionary with the hyperparameters of the model as key and and a list of respective parametrizations as value. The hyperparameter search is performed over the cartesian product of the provided lists. Example:
{"n_centers": [20, 50, 100, 200],
 "center_sampling_method": ["agglomerative", "k_means", "random"],
 "keep_edges": [True, False]
}
random_state – (int) seed used by the random number generator for shuffeling the data
-
get_configuration(deep=True)¶ Get parameter configuration for this estimator.
- Parameters
deep – boolean, optional If True, will return the parameters for this estimator and contained subobjects that are estimators.
- Returns
params - mapping of string to any Parameter names mapped to their values.
-
get_params(deep=True)¶ Get parameters for this estimator.
- Parameters
deep (boolean, optional) – If True, will return the parameters for this estimator and contained subobjects that are estimators.
- Returns
params – Parameter names mapped to their values.
- Return type
mapping of string to any
-
get_params_internal(**tags)¶ Internal method to be implemented which does not perform caching
-
kurtosis(x_cond, n_samples=1000000)¶ Kurtosis of the fitted distribution conditioned on x_cond
- Parameters
x_cond – different x values to condition on - numpy array of shape (n_values, ndim_x)
- Returns
Kurtosis Kurt[y|x] corresponding to x_cond - numpy array of shape (n_values, ndim_y, ndim_y)
-
log_pdf(X, Y)¶ Predicts the conditional log-probability log p(y|x). Requires the model to be fitted.
- Parameters
X – numpy array to be conditioned on - shape: (n_samples, n_dim_x)
Y – numpy array of y targets - shape: (n_samples, n_dim_y)
- Returns
onditional log-probability log p(y|x) - numpy array of shape (n_query_samples, )
-
mean_(x_cond, n_samples=1000000)¶ Mean of the fitted distribution conditioned on x_cond :param x_cond: different x values to condition on - numpy array of shape (n_values, ndim_x)
- Returns
Means E[y|x] corresponding to x_cond - numpy array of shape (n_values, ndim_y)
-
mean_std(x_cond, n_samples=1000000)¶ - Computes Mean and Covariance of the fitted distribution conditioned on x_cond.
Computationally more efficient than calling mean and covariance computatio separately
- Parameters
x_cond – different x values to condition on - numpy array of shape (n_values, ndim_x)
- Returns
Means E[y|x] and Covariances Cov[y|x]
-
pdf(X, Y)¶ Predicts the conditional probability p(y|x). Requires the model to be fitted.
- Parameters
X – numpy array to be conditioned on - shape: (n_samples, n_dim_x)
Y – numpy array of y targets - shape: (n_samples, n_dim_y)
- Returns
conditional probability p(y|x) - numpy array of shape (n_query_samples, )
-
plot2d(x_cond=[0, 1, 2], ylim=(-8, 8), resolution=100, mode='pdf', show=True, prefix='', numpyfig=False)¶ Generates a 3d surface plot of the fitted conditional distribution if x and y are 1-dimensional each
- Parameters
xlim – 2-tuple specifying the x axis limits
ylim – 2-tuple specifying the y axis limits
resolution – integer specifying the resolution of plot
-
plot3d(xlim=(-5, 5), ylim=(-8, 8), resolution=100, show=False, numpyfig=False)¶ Generates a 3d surface plot of the fitted conditional distribution if x and y are 1-dimensional each
- Parameters
xlim – 2-tuple specifying the x axis limits
ylim – 2-tuple specifying the y axis limits
resolution – integer specifying the resolution of plot
-
predict_density(X, Y=None, resolution=50)¶ Computes conditional density p(y|x) over a predefined grid of y target values
- Parameters
X – values/vectors to be conditioned on - shape: (n_instances, n_dim_x)
Y – (optional) y values to be evaluated from p(y|x) - if not set, Y will be a grid with with specified resolution
resulution – integer specifying the resolution of simulation_eval grid
- Returns: tuple (P, Y)
P - density p(y|x) - shape (n_instances, resolution**n_dim_y)
Y - grid with with specified resolution - shape (resolution**n_dim_y, n_dim_y) or a copy of Y in case it was provided as argument
-
score(X, Y)¶ Computes the mean conditional log-likelihood of the provided data (X, Y)
- Parameters
X – numpy array to be conditioned on - shape: (n_query_samples, n_dim_x)
Y – numpy array of y targets - shape: (n_query_samples, n_dim_y)
- Returns
average log likelihood of data
-
set_params(**params)¶ Set the parameters of this estimator.
The method works on simple estimators as well as on nested objects (such as pipelines). The latter have parameters of the form
<component>__<parameter>so that it’s possible to update each component of a nested object.- Returns
- Return type
self
-
skewness(x_cond, n_samples=1000000)¶ Skewness of the fitted distribution conditioned on x_cond
- Parameters
x_cond – different x values to condition on - numpy array of shape (n_values, ndim_x)
- Returns
Skewness Skew[y|x] corresponding to x_cond - numpy array of shape (n_values, ndim_y, ndim_y)
-
std_(x_cond, n_samples=1000000)¶ Standard deviation of the fitted distribution conditioned on x_cond
- Parameters
x_cond – different x values to condition on - numpy array of shape (n_values, ndim_x)
- Returns
Standard deviations sqrt(Var[y|x]) corresponding to x_cond - numpy array of shape (n_values, ndim_y)
-
tail_risk_measures(x_cond, alpha=0.01, n_samples=1000000)¶ Computes the Value-at-Risk (VaR) and Conditional Value-at-Risk (CVaR)
- Parameters
x_cond – different x values to condition on - numpy array of shape (n_values, ndim_x)
alpha – quantile percentage of the distribution
n_samples – number of samples for monte carlo model_fitting
- Returns
VaR values for each x to condition on - numpy array of shape (n_values)
CVaR values for each x to condition on - numpy array of shape (n_values)
-
value_at_risk(x_cond, alpha=0.01, n_samples=1000000)¶ Computes the Value-at-Risk (VaR) of the fitted distribution. Only if ndim_y = 1
- Parameters
x_cond – different x values to condition on - numpy array of shape (n_values, ndim_x)
alpha – quantile percentage of the distribution
- Returns
VaR values for each x to condition on - numpy array of shape (n_values)
- REZENDE2015
Rezende, Mohamed (2015). Variational Inference with Normalizing Flows (http://arxiv.org/abs/1505.05770)
- TRIPPE2018
Trippe, Turner (2018). Conditional Density Estimation with Bayesian Normalising Flows (http://arxiv.org/abs/1802.04908)